PFAS in US Tap Water: State-by-State Results From the EPA’s Final Data
The EPA has published the final results of its nationwide PFAS testing (UCMR 5): 29 “forever chemicals” measured in 10,312 public water systems between 2023 and 2026. We compared every system’s results with the federal limits set in April 2024, using the EPA’s own method, and added how many people each system serves.
Key findings
- 1,125 of the 10,123 water systems with complete results (11.1%) averaged above the April 2024 federal limit for PFOA or PFOS at one or more sampling points. Counting all six regulated PFAS, the total is 1,134: only 9 systems were above a limit the EPA now proposes to drop without also being above the PFOA or PFOS limit.
- Those 1,125 systems serve about 54.0 million people, 18% of the 300 million people served by the systems tested.
- Large systems were affected more often: 15.4% of systems serving more than 10,000 people were above a limit, against 8.1% of smaller systems.
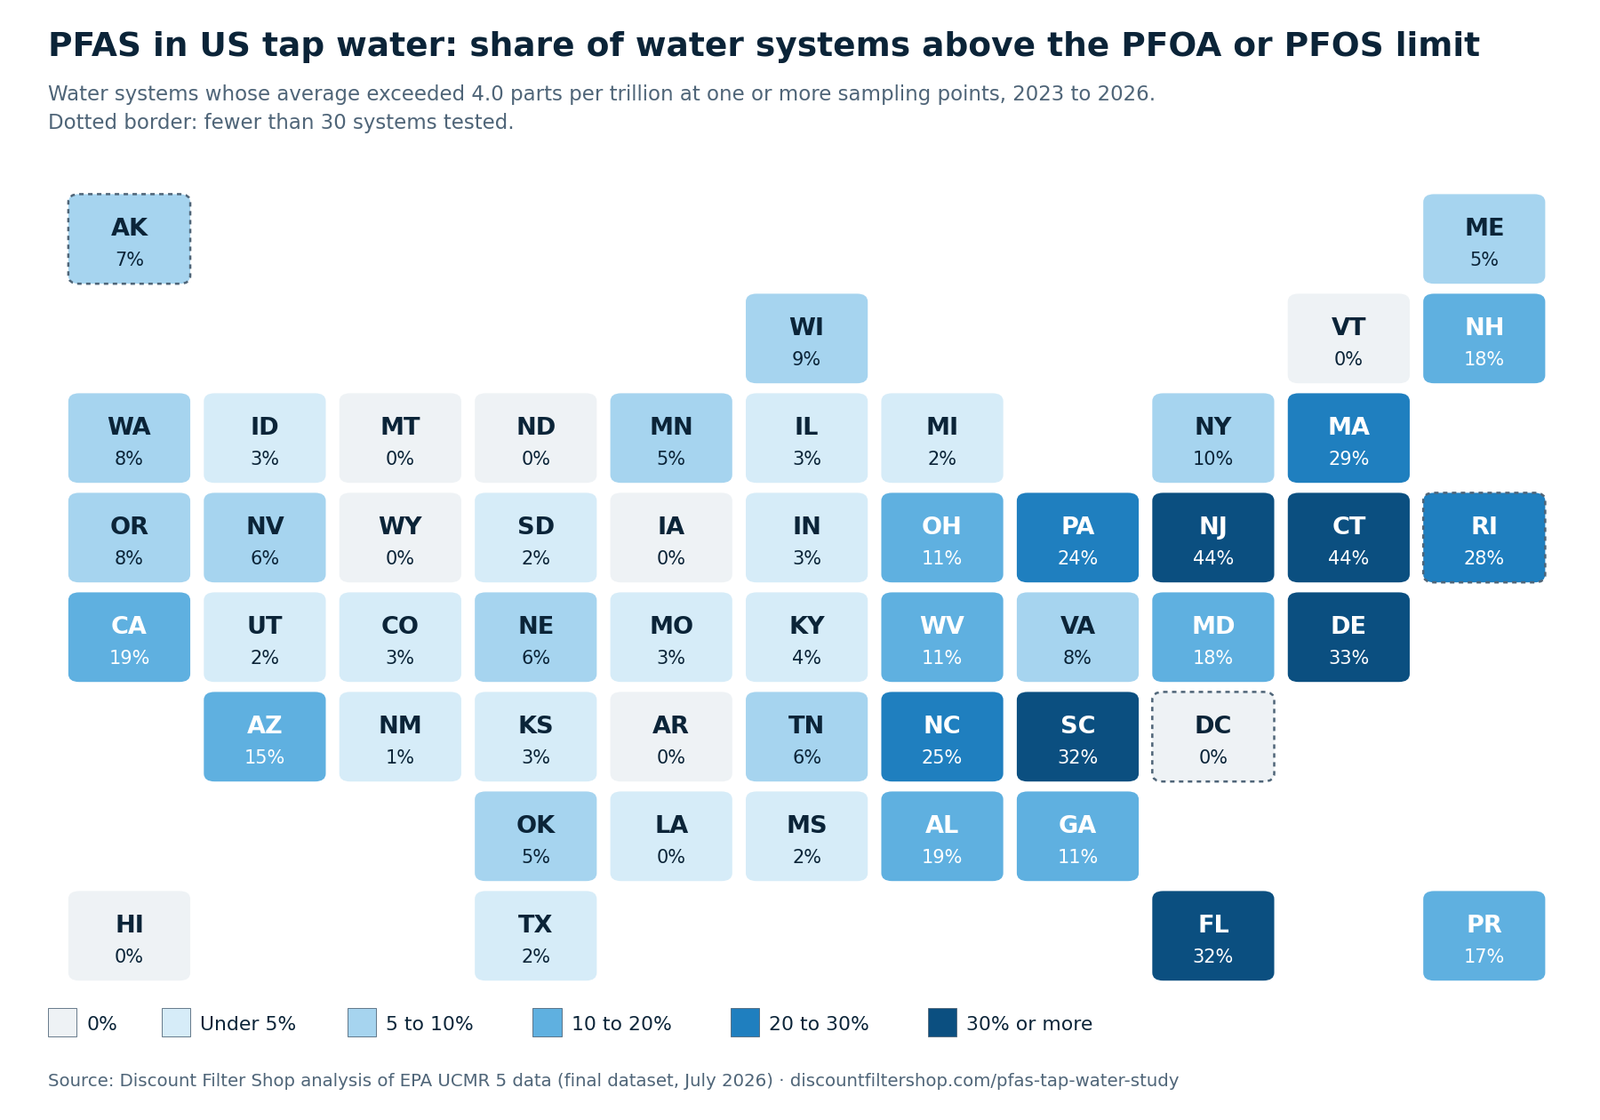
- Connecticut (44.4%), New Jersey (44.0%), Delaware (33.3%), Florida (32.2%) and South Carolina (31.8%) had the highest share of water systems above the PFOA or PFOS limit. In New Jersey, the systems above the limit serve 58% of the people covered by the testing.
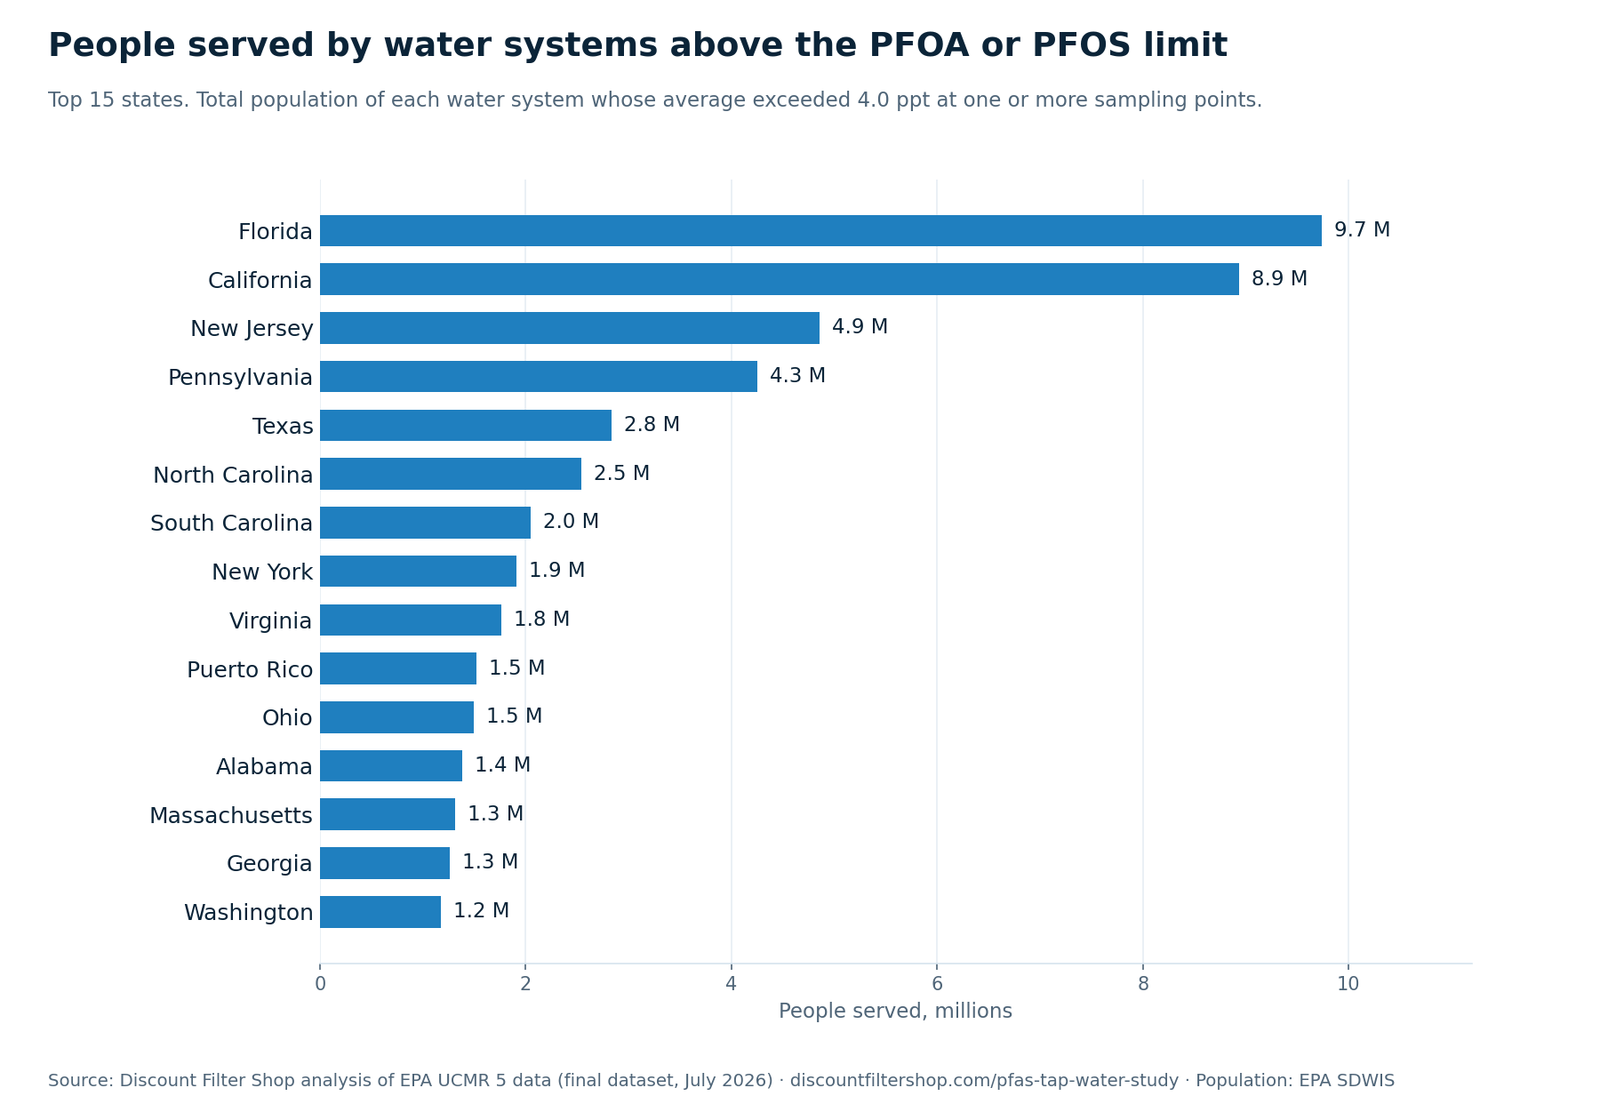
- Florida (9.7 million people) and California (8.9 million) have the most people served by systems above the limit.
- 5 states with at least 30 systems tested had none above any limit: Arkansas, Hawaii, Montana, North Dakota and Vermont.
- The PFAS found most often are short-chain compounds with no federal limit: PFPeA (2,066 systems), PFBA (1,935 systems) and PFHxA (1,807 systems).
PFAS in drinking water by state
Share of each state’s water systems whose average was above the PFOA or PFOS limit (4.0 parts per trillion) at one or more sampling points. States marked with a dotted border had fewer than 30 systems tested.
| State | Systems tested | Any PFAS found | Systems above PFOA or PFOS limit | Share above | People served by systems above |
|---|---|---|---|---|---|
| Connecticut | 63 | 64% | 28 | 44.4% | 1,167,057 |
| New Jersey | 257 | 65% | 113 | 44.0% | 4,854,375 |
| Delaware | 36 | 47% | 12 | 33.3% | 633,592 |
| Florida | 394 | 47% | 127 | 32.2% | 9,737,056 |
| South Carolina | 154 | 55% | 49 | 31.8% | 2,045,256 |
| Massachusetts | 260 | 55% | 74 | 28.5% | 1,312,786 |
| North Carolina | 277 | 49% | 68 | 24.5% | 2,539,472 |
| Pennsylvania | 386 | 45% | 93 | 24.1% | 4,253,331 |
| California | 683 | 35% | 129 | 18.9% | 8,933,139 |
| Alabama | 302 | 37% | 56 | 18.5% | 1,386,519 |
| Maryland | 82 | 35% | 15 | 18.3% | 162,517 |
| New Hampshire | 51 | 35% | 9 | 17.6% | 222,628 |
| Puerto Rico | 99 | 39% | 17 | 17.2% | 1,520,695 |
| Arizona | 150 | 38% | 22 | 14.7% | 848,964 |
| Ohio | 343 | 40% | 37 | 10.8% | 1,495,369 |
| Georgia | 253 | 31% | 27 | 10.7% | 1,261,810 |
| West Virginia | 103 | 33% | 11 | 10.7% | 103,805 |
| New York | 329 | 30% | 32 | 9.7% | 1,908,026 |
| Wisconsin | 202 | 26% | 19 | 9.4% | 185,042 |
| Washington | 246 | 28% | 20 | 8.1% | 1,176,316 |
| Oregon | 127 | 14% | 10 | 7.9% | 226,333 |
| Virginia | 167 | 32% | 13 | 7.8% | 1,762,533 |
| Tennessee | 273 | 32% | 17 | 6.2% | 343,696 |
| Nebraska | 53 | 13% | 3 | 5.7% | 83,158 |
| Nevada | 54 | 19% | 3 | 5.6% | 488,064 |
| Minnesota | 196 | 45% | 10 | 5.1% | 270,387 |
| Oklahoma | 160 | 41% | 8 | 5.0% | 238,745 |
| Maine | 40 | 25% | 2 | 5.0% | 22,328 |
| Kentucky | 230 | 37% | 9 | 3.9% | 199,762 |
| Idaho | 61 | 15% | 2 | 3.3% | 21,500 |
| Kansas | 103 | 34% | 3 | 2.9% | 77,468 |
| Illinois | 485 | 26% | 13 | 2.7% | 353,647 |
| Indiana | 229 | 24% | 6 | 2.6% | 166,389 |
| Missouri | 229 | 31% | 6 | 2.6% | 73,399 |
| Colorado | 162 | 24% | 4 | 2.5% | 101,207 |
| Texas | 1,122 | 53% | 27 | 2.4% | 2,836,693 |
| Mississippi | 234 | 4% | 5 | 2.1% | 84,633 |
| South Dakota | 49 | 14% | 1 | 2.0% | 4,100 |
| Michigan | 319 | 14% | 5 | 1.6% | 219,330 |
| Utah | 129 | 12% | 2 | 1.6% | 14,975 |
| New Mexico | 72 | 15% | 1 | 1.4% | 2,286 |
| Louisiana | 261 | 18% | 1 | 0.4% | 6,354 |
| Arkansas | 170 | 6% | 0 | 0.0% | 0 |
| Hawaii | 45 | 4% | 0 | 0.0% | 0 |
| Iowa | 147 | 20% | 0 | 0.0% | 0 |
| Montana | 44 | 11% | 0 | 0.0% | 0 |
| North Dakota | 37 | 19% | 0 | 0.0% | 0 |
| Vermont | 38 | 8% | 0 | 0.0% | 0 |
| Wyoming | 33 | 9% | 0 | 0.0% | 0 |
| Fewer than 30 water systems tested | |||||
| Northern Mariana Islands* | 1 | 100% | 1 | 100.0% | 48,524 |
| US Virgin Islands* | 3 | 33% | 1 | 33.3% | 550 |
| Rhode Island* | 29 | 52% | 8 | 27.6% | 220,864 |
| Guam* | 5 | 60% | 1 | 20.0% | 139,207 |
| Alaska* | 28 | 32% | 2 | 7.1% | 226,251 |
| American Samoa* | 1 | 100% | 0 | 0.0% | 0 |
| District of Columbia* | 3 | 100% | 0 | 0.0% | 0 |
| Tribal water systems | 114 | 13% | 3 | 2.6% | 43,454 |
* Fewer than 30 water systems tested, so the share can swing with one system. Tribal water systems are grouped together. “Any PFAS found” means at least one of the 29 PFAS at or above the EPA’s minimum reporting level.
The largest water systems above the limit
The 15 water systems serving the most people among those whose average was above the PFOA or PFOS limit at one or more sampling points. Averages are the highest sampling point average for each system, in parts per trillion (ppt). The limit is 4.0 ppt for each chemical.
| Water system (as named by the EPA) | State | People served | PFOA (ppt) | PFOS (ppt) |
|---|---|---|---|---|
| MDWASA – MAIN SYSTEM | FL | 2,377,460 | 12.3 | 31.4 |
| PHILADELPHIA WATER DEPARTMENT | PA | 1,600,000 | 7.3 | 5.0 |
| FAIRFAX COUNTY WATER AUTHORITY | VA | 1,121,613 | 4.6 | 2.6 |
| SUFFOLK COUNTY WATER AUTHORITY | NY | 1,100,000 | 6.0 | 12.1 |
| METROPOLITANO | PR | 1,084,637 | 2.7 | 6.2 |
| CITY OF FORT WORTH | TX | 955,900 | 5.9 | 6.2 |
| AQUA PA MAIN SYSTEM | PA | 822,600 | 11.8 | 8.9 |
| SUEZ WATER NEW JERSEY HACKENSACK | NJ | 792,713 | 13.0 | 6.3 |
| CINCINNATI PUBLIC WATER SYSTEM | OH | 750,200 | 0.0 | 5.2 |
| EL PASO WATER UTILITIES PUBLIC SERVICE B | TX | 747,168 | 0.0 | 6.4 |
| CITY OF TAMPA WATER DEPARTMENT | FL | 733,886 | 2.2 | 5.7 |
| PALM BEACH COUNTY WATER UTILITIES | FL | 671,114 | 8.2 | 19.0 |
| NJ AMERICAN WATER – RARITAN | NJ | 615,430 | 6.6 | 6.0 |
| CITY OF FRESNO | CA | 545,716 | 13.5 | 21.5 |
| CITY OF SACRAMENTO MAIN | CA | 527,979 | 16.4 | 38.8 |
A large system can have dozens of sampling points, and only one of them needs to be above the limit for the system to be listed. The full list of 1,134 systems is in the downloadable data.
The highest levels measured
The 10 water systems with the highest sampling point average for PFOA or PFOS, of any size.
| Water system | State | People served | PFAS | Average (ppt) |
|---|---|---|---|---|
| NASHVILLE, TOWN OF | NC | 5,900 | PFOS | 345.0 |
| POTRERO ELEMENTARY SCHOOL | CA | 300 | PFOA | 181.4 |
| RUNNING SPRINGS WATER DISTRICT | CA | 5,268 | PFOS | 131.0 |
| EMMAUS BOROUGH PUBLIC WATER | PA | 14,000 | PFOS | 127.0 |
| YESHIVA FARM SETTLEMENT | NY | 300 | PFOS | 94.5 |
| LUBECK PSD | WV | 11,724 | PFOA | 89.8 |
| ORANGEWOOD WATER SYSTEM | FL | 6,464 | PFOS | 78.1 |
| GWA NORTHERN WATER SYSTEM | GU | 139,207 | PFOS | 67.5 |
| PEQUENAKONCK ELEMENTARY SCHOOL | NY | 700 | PFOA | 55.8 |
| TEMPE CITY OF | AZ | 165,000 | PFOS | 55.2 |
Which PFAS show up most often
Number of water systems with at least one result at or above the EPA’s minimum reporting level, for the 10 PFAS found most often. Five of the six PFAS regulated in 2024 are in this list, but the three most common have no federal limit.
Large and small systems, wells and rivers
Systems serving more than 10,000 people were almost twice as likely to be above a limit (15.4%, 660 of 4,273) as systems serving 10,000 people or fewer (8.1%, 474 of 5,850). By source, 8.0% of sampling points drawing on ground water were above a limit, against 6.9% of those drawing on surface water or mixed sources.
The EPA’s July 2026 data summary reports nearly identical figures: 15.5% of large systems above a limit, and 8.3% and 7.1% for the two groups of smaller systems it tracks separately.
Where the federal rules stand (October 2026)
In April 2024, the EPA set the first national drinking water limits for PFAS: 4.0 parts per trillion (ppt) each for PFOA and PFOS, 10 ppt each for PFHxS, PFNA and HFPO-DA (known as GenX), and a Hazard Index for mixtures of PFHxS, PFNA, HFPO-DA and PFBS. Water systems have until 2029 to comply.
In May 2026, the EPA proposed two changes: keep the 4.0 ppt limits for PFOA and PFOS while letting water systems apply for two more years (until 2031), and rescind the limits for the other four PFAS and the Hazard Index. The public comment period closed in July 2026. Until a final rule is published, the April 2024 limits remain in effect. Some states also set their own limits.
UCMR 5 results do not show whether a water system complies with the law: compliance will be judged on running annual averages of compliance monitoring once the deadline arrives. Many utilities have added treatment or changed sources since their samples were taken.
What you can do at home
- Check your ZIP code. Our free tap water report shows the PFAS results for the water systems that serve your ZIP code, from the same EPA data.
- Read your utility’s latest water quality report (the Consumer Confidence Report), which includes its UCMR results and any newer testing.
- If you filter at home, check the certification. The EPA recommends filters certified under NSF/ANSI 53 or NSF/ANSI 58 for PFAS reduction. Most refrigerator filters are not certified for PFAS. Among the genuine filters we carry, these list PFOA and PFOS reduction: A filter only works while it is within its rated life, so replace it on schedule.
Questions
Is my tap water unsafe if my water system is listed? Not necessarily. These are averages of samples taken between 2023 and 2026, and they do not determine legal compliance. Many systems have since added treatment or changed sources. Check your utility’s latest water quality report or contact the utility.
What is the federal limit for PFAS in drinking water? The April 2024 national standards set 4.0 parts per trillion (ppt) for PFOA and for PFOS, 10 ppt for PFHxS, PFNA and HFPO-DA (GenX), and a Hazard Index for mixtures. In May 2026, the EPA proposed to keep the PFOA and PFOS limits, with a possible extension to 2031, and to rescind the others.
What does 4 parts per trillion mean? One part per trillion is one nanogram per liter of water. In this testing, 4 ppt was also the lowest level laboratories could report for PFOA and PFOS, so any PFOA or PFOS result reported was at or above that level.
Do refrigerator water filters remove PFAS? Only some do. A refrigerator filter reduces PFAS only if its certification (from NSF, IAPMO or another accredited body) lists PFOA and PFOS reduction. Many refrigerator filters are certified for chlorine taste and odor, lead or cysts, but not for PFAS.
How can I find PFAS results for my ZIP code? Use our free tap water report: enter your ZIP code to see the PFAS results of the water systems that serve it, from the same EPA data.
Can I reuse this data and these charts? Yes. The tables, charts and files on this page are free to reuse under a Creative Commons Attribution 4.0 license. Please credit Discount Filter Shop and link to this page.
Methodology
Data: the EPA’s UCMR 5 occurrence data, final release (July 2026), with results for 29 PFAS from 10,312 public water systems: every system serving 3,300 people or more and a representative sample of smaller systems. Population served comes from the EPA’s Safe Drinking Water Information System (SDWIS), downloaded in October 2026.
Method: we followed the EPA’s own comparison (UCMR 5 Data Summary, Table 4). For each sampling point with a complete set of results (two samples for ground water, four for surface water), we averaged the results, counting results below the reporting level as zero, and compared the average with the April 2024 limits using the EPA’s rounding (an average of 4.05 ppt or more counts as above the 4.0 ppt limits for PFOA and PFOS). A water system counts as above a limit when at least one of its sampling points is.
Check: our counts match the EPA’s published figures, for example 523 large systems above the PFOS limit (EPA: 523), 474 systems serving 10,000 people or fewer above any limit (EPA: 474) and 3,595 systems with at least one PFAS found (EPA: 3,595).
Limitations: the population is the total served by each water system, even when only one of its sampling points was above a limit, and some people are counted twice when one system buys water from another. UCMR 5 results are not compliance determinations. Discount Filter Shop sells refrigerator water filters, including some certified to reduce PFOA and PFOS; this analysis uses only public EPA data, and every number can be checked against the files below.
Download the data
- PFAS results by state (CSV)
- The 1,134 water systems above a limit, with population and averages (CSV)
- Map: share of water systems above the PFOA or PFOS limit, by state (PNG)
- Chart: people served by water systems above the limit, top 15 states (PNG)
License: CC BY 4.0. Suggested credit: “Source: Discount Filter Shop analysis of EPA UCMR 5 data” with a link to this page. Questions from journalists: support@discountfiltershop.com.
Sources
- EPA, UCMR occurrence data and Fifth Unregulated Contaminant Monitoring Rule (UCMR 5 Data Summary, July 2026)
- EPA, PFAS National Primary Drinking Water Regulation
- EPA, Proposed PFOA and PFOS compliance extension rule and proposed PFAS rescission rule
- EPA, Safe Drinking Water Information System (SDWIS)